Enviromental Data
Environmental Activities in FY 2023
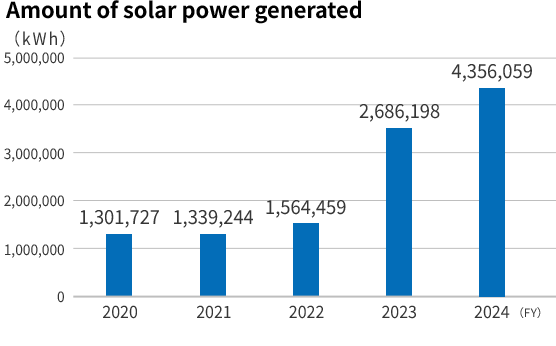
In growth fields such as semiconductors and electronic devices, we are actively investing in regions across the world, with a particular focus on China and South Korea, which are positioned as strategically important regions, and we are promoting capital investment. Regarding the material balance, electricity consumption increased in these strategic regions. To save energy, having set a target of a 1% reduction in greenhouse gas (GHG) emissions compared with the result for the previous year (ULVAC standard), we promoted installation of renewable energy facilities such as solar power generation facilities and vigorous procurement of renewable energy. We have also revised the baseline year for the "Greenhouse Gas Emissions Reduction Target" to 2023 and changed the reduction target from 30% to 50%.
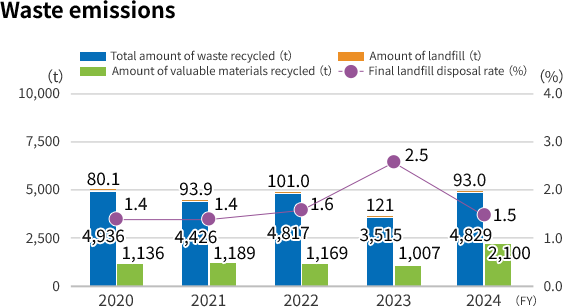
Waste overall emissions have decreased. A significant reduction was observed in waste oil and waste acid, with the reduction in the use of cutting oil due to the renewal of processing equipment in China being a contributing factor for waste oil. There have been no significant changes in other types of waste, and the proportion of waste directed to final disposal relative to total emissions has increased, resulting in a 0.9% increase in the final disposal rate.
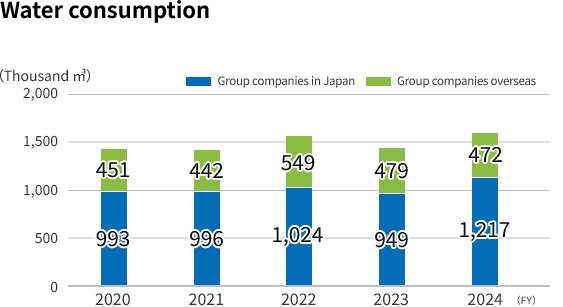
Regarding water, the total water intake decreased by 8% compared to the previous year. The target for reducing unit water consumption* to below the 2020 level (0.77) was also achieved, with a result of 0.55. Going forward, we will continue to manage and work towards reducing our environmental impact related to water.
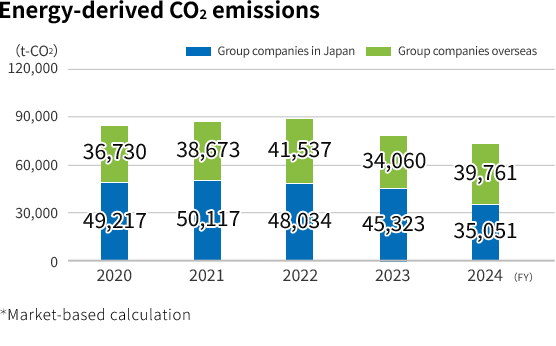
In the fiscal year in question, we reduced greenhouse gas emissions by 7.1% compared to the previous year. Specifically, the introduction of renewable energy accounted for a reduction of 3,656 tons of CO2, and energy conservation activities contributed to a further reduction of 2,707 tons of CO2.
* Water usage per unit: Water intake / Sales revenue (consolidated)
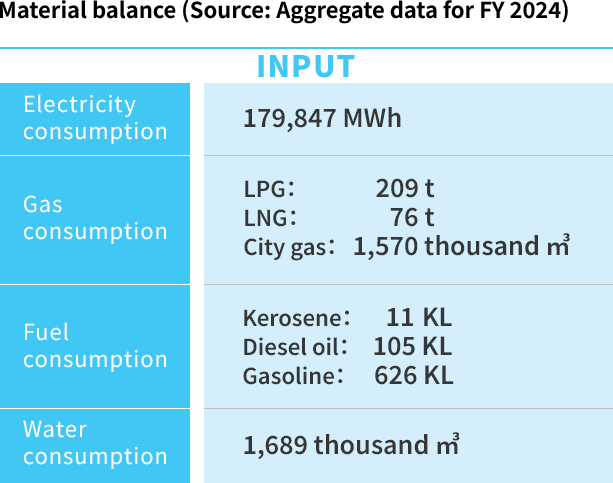
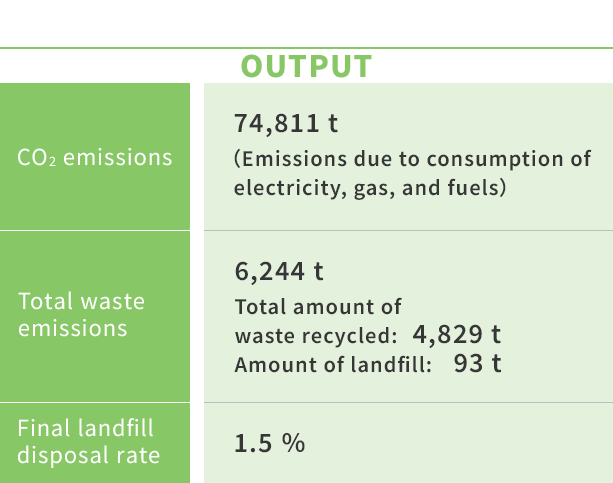
Efficient Use of Water
There are concerns worldwide about water risks, such as heavy rainfall, flooding, and water shortages, due to ongoing climate change.
We assess and confirm the impact of water risks on our business.
We identify sites exposed to water risks by using the WRI Aqueduct, a water risk assessment tool, focusing on the sites with high environmental impact as defined by the Company. We define sites with extremely high or high baseline water stress as water-stressed areas. The sites exposed to water risks are located in parts of China and Thailand, and account for 8% of the ULVAC Group on a consolidated basis. This includes coating business sites involved in high-environmental-impact, and in addition to the overall group's water usage reduction targets, specific targets are set for each subsidiary, and concrete actions are being promoted.
Management of Chemical Substances
Prior to the use of chemical substances in the manufacturing process, we conduct risk assessment, in which the amount of the substance to be used and the protective equipment necessary are confirmed, in an effort to ensure worker safety and minimize the environmental impact. Moreover, in order to ensure compliance with the environmental regulations of various countries concerning products, a cross-organizational team whose members are drawn from quality assurance, procurement, and environmental divisions is playing a central role in establishing a structure for management of chemical substances contained in products, thus ensuring provision of environmentally friendly products. Furthermore, we collect information in order to appropriately respond to environmental laws and regulations, which undergo frequent revisions, and conduct in-house education on chemical substances contained in products for which external lecturers are invited, thus supporting manufacturing in compliance with environmental regulations. This education is not limited to ULVAC's business divisions but also covers our business partners. We are promoting establishment of a management structure covering the entire supply chain.
Waste Management
Promotion of Waste Material Recycling
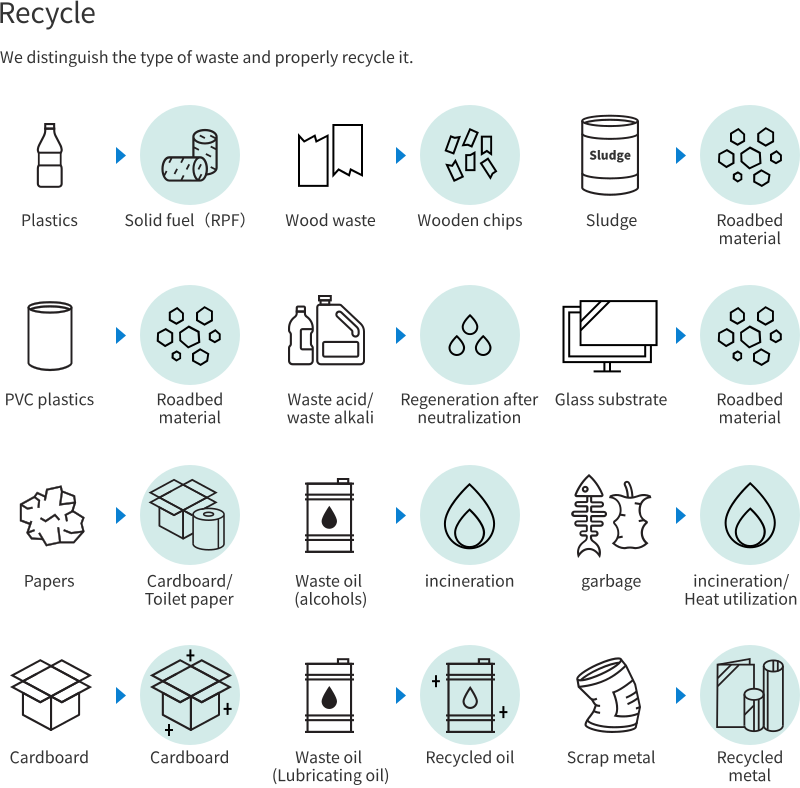
The ULVAC Group is working as one Group to ensure proper waste management and reduce waste generation, with the aim of promoting resource circulation and reduce environmental impact. We are working to improve understanding of our responsibilities as a waste-generating business operator and of compliance. We also confirm that waste is properly treated through regular on-site checks of waste treatment contractors.
As a waste management target for the Group in Japan, we have set a goal of reducing waste plastic disposal intensity by 5% compared with the 2024 level by 2030. To achieve this target, we provide waste management education by external experts and monitor trends in waste generation and the factors behind increases and decreases.
We are also promoting resource circulation initiatives to reduce waste generation, including thorough waste separation, the reuse of packaging and cushioning materials, and material reduction in collaboration with our business partners.
● Waste recycling
We comply with laws and regulations, dispose of waste appropriately, and reduce the amount of waste by taking back equipment that customers no longer need, refurbishing it, and reselling it.
For more details, please visit the ULVAC Techno, Ltd. website. (Japanese only)
● Metal recycling
We will promote the reduction of underground resource consumption through the recycling of metals and the active use of recycled products.
For more details, please visit the ULVAC Techno, Ltd. website. (Japanese only)
Sustainability Data
Greenhouse gases
■CO2 emissions(t-CO2)
| FY2020 Jun. 2021 |
FY2021 Jun. 2022 |
FY2022 Jun. 2023 |
FY2023 Jun. 2024 |
FY2024 Jun. 2025 |
||
| Scope1+2(location-based) | ULVAC Group | 90,933 | 92,052 | 90,305 | 88,362◎ | 97,153◎ |
| ULVAC Group in Japan | 55,829 | 55,560 | 52,123 | 49,833 | 52,639 | |
| ULVAC Group overseas | 35,105 | 36,492 | 38,181 | 38,528 | 44,514 | |
| Scope1+2(market-based) | ULVAC Group | 85,947 | 88,790 | 89,571 | 79,385◎ | 76,952◎ |
| ULVAC Group in Japan | 49,217 | 50,117 | 48,034 | 45,323 | 35,928 | |
| ULVAC Group overseas | 36,730 | 38,673 | 41,537 | 34,060 | 41,024 | |
| Scope1 | ULVAC Group | 5,829 | 6,020 | 6,874 | 6,823◎ | 5,649◎ |
| ULVAC Group in Japan | 4,521 | 4,707 | 5,463 | 4,844 | 3,483 | |
| ULVAC Group overseas | 1,308 | 1,313 | 1,411 | 1,978 | 2,165 | |
| Energy-related | ULVAC Group | 5,829 | 6,020 | 6,398 | 6,733 | 5,231 |
| ULVAC Group in Japan | 4,521 | 4,707 | 4,987◎ | 4,754 | 3,149 | |
| ULVAC Group overseas | 1,308 | 1,313 | 1,411 | 1,978 | 2,082 | |
| Total greenhouse gas emissions excluding energy sources | ULVAC Group | 476 | 90 | 418 | ||
| ULVAC Group in Japan | 476 | 90 | 335 | |||
| ULVAC Group overseas | 0 | 0 | 84 | |||
| HFCs | ULVAC Group | 18 | 0 | 22 | ||
| ULVAC Group in Japan | 18 | 0 | 22 | |||
| ULVAC Group overseas | 0 | 0 | 0 | |||
| PFCs | ULVAC Group | 35 | 6 | 185 | ||
| ULVAC Group in Japan | 35 | 6 | 101 | |||
| ULVAC Group overseas | 0 | 0 | 84 | |||
| SF6 | ULVAC Group | 423 | 85 | 212 | ||
| ULVAC Group in Japan | 423 | 85 | 212 | |||
| ULVAC Group overseas | 0 | 0 | 0 | |||
| Others | ULVAC Group | 0 | 0 | 0 | ||
| ULVAC Group in Japan | 0 | 0 | 0 | |||
| ULVAC Group overseas | 0 | 0 | 0 | |||
| Scope2(location-based) | ULVAC Group | 85,104 | 86,032 | 83,431 | 81,539◎ | 91,504◎ |
| ULVAC Group in Japan | 51,308 | 50,852 | 46,660◎ | 44,989 | 49,156 | |
| ULVAC Group overseas | 33,796 | 35,180 | 36,770 | 36,550 | 42,348 | |
| Scope2(market-based) | ULVAC Group | 80,118 | 82,770 | 82,697 | 72,562◎ | 71,303◎ |
| ULVAC Group in Japan | 44,696 | 45,410 | 42,571◎ | 40,479 | 32,444 | |
| ULVAC Group overseas | 35,422 | 37,360 | 40,126 | 32,082 | 38,859 | |
| Scope3 | ULVAC Group | 5,752,603 | 7,630,671 | 5,171,285 (※1) |
5,063,481 (※1) |
5,285,241 (※1) |
| By Category | ||||||
| 1. Purchased goods and services | 131,892 (※2) |
247,989 (※2) |
439,009 | 472,952 | 481,190 | |
| 2. Capital goods | 21,512 | 22,105 | 49,096 | 59,842 | 34,157 | |
| 3. Fuel- and energy-related activities | 11,593 | 11,468 | 12,414 | 12,415 | 14,574◎ | |
| 4. Upstream transportation and distribution | (Included in category 1) | (Included in category 1) | 141,350 | 155,415 | 169,717 | |
| 5. Waste generated in operations | 42,504 | 43,257 | 1,383 | 839 | 993 | |
| 6. Business travel | 5,531 | 6,752 | 14,197 | 14,549 | 16,516 | |
| 7. Employee commuting | 2,785 | 2,828 | 4,565 | 4,681 | 4,864 | |
| 8. Upstream leased assets | (N/A) | (N/A) | (N/A) | (N/A) | (N/A) | |
| 9. Downstream transportation and distribution | 23,048 (※2) |
27,141 (※2) |
241,384 | 261,193 | 267,845 | |
| 10. Processing of sold products | (N/A) | (N/A) | (N/A) | (N/A) | (N/A) | |
| 11. Use of sold products | 5,513,023 | 7,268,921 | 4,262,081 | 4,076,253 | 4,289,287 | |
| 12. End-of-life treatment of sold products | 715 | 210 | 188 | 147 | 166 | |
| 13. Downstream leased assets | (Included in category 11) | (Included in category 11) | (N/A) | (N/A) | (N/A) | |
| 14. Franchises | (N/A) | (N/A) | (N/A) | (N/A) | (N/A) | |
| 15. Investments | (N/A) | (N/A) | 5,618 | 5,195 | 5,932 |
※1 We have revised the figures for fiscal year 2022 (ending June 2023) and beyond due to a review of the Scope 3 calculation method and other factors.
※2 ULVAC stand-alone aggregate
◎ are assured by an independent third party.
■Renewable energy consumption(MWh)
| FY2020 Jun. 2021 |
FY2021 Jun. 2022 |
FY2022 Jun. 2023 |
FY2023 Jun. 2024 |
FY2024 Jun. 2025 |
||
| Green energy purchases | ULVAC Group | 0 | 0 | 0 | 2,516 | 5,968 |
| ULVAC Group in Japan | 0 | 0 | 0 | 1,210 | 2,804 | |
| ULVAC Group overseas | 0 | 0 | 0 | 1,306 | 3,164 | |
| Green energy certificates | ULVAC Group | 0 | 1,102 | 4,951 | 7,405 | 25,967 |
| ULVAC Group in Japan | 0 | 1,102 | 4,951 | 7,405 | 25,967 | |
| ULVAC Group overseas | 0 | 0 | 0 | 0 | 0 | |
| Solar cell power generation (self-consumption + electricity sales) | ULVAC Group | 1,302 | 1,339 | 1,564 | 2,686 | 4,113 |
| ULVAC Group in Japan | 876 | 928 | 1,150 | 1,743 | 2,009 | |
| ULVAC Group overseas | 426 | 411 | 414 | 944 | 2,104 | |
| Solar cell power generation (self-consumption) | ULVAC Group | 438 | 425 | 662 | 1,596 | 3,023 |
| ULVAC Group in Japan | 438 | 425 | 662 | 1,206 | 1,532 | |
| ULVAC Group overseas | 0 | 0 | 0 | 391 | 1,491 | |
| Total | ULVAC Group | 438 | 1,527 | 5,613 | 11,517 | 34,958 |
| ULVAC Group in Japan | 438 | 1,527 | 5,613 | 8,611 | 30,303 | |
| ULVAC Group overseas | 0 | 0 | 0 | 391 | 4,655 |
■Energy consumption※1
| FY2020 Jun. 2021 |
FY2021 Jun. 2022 |
FY2022 Jun. 2023 |
FY2023 Jun. 2024 |
FY2024 Jun. 2025 |
||
| Electricity(MWh) | ULVAC Group | 162,979 | 168,152 | 167,203 | 170,058 | 185,853 |
| ULVAC Group in Japan | 102,596 | 104,484 | 98,005 | 98,420 | 101,820 | |
| ULVAC Group overseas | 60,382 | 63,668 | 69,198 | 71,638 | 84,033 | |
| City gas(Thousand m3) | ULVAC Group | 1,275 | 1,346 | 1,402 | 1,120 | 1,570 |
| ULVAC Group in Japan | 801 | 875 | 812 | 816 | 858 | |
| ULVAC Group overseas | 474 | 472 | 591 | 304 | 712 | |
| LPG(t) | ULVAC Group | 240 | 217 | 243 | 200 | 234 |
| ULVAC Group in Japan | 223 | 215 | 241 | 199 | 231 | |
| ULVAC Group overseas | 1 | 2 | 2 | 2 | 3 | |
| LNG(t) | ULVAC Group | 683 | 704 | 658 | 625 | 75 |
| ULVAC Group in Japan | 683 | 704 | 658 | 625 | 75 | |
| ULVAC Group overseas | 0 | 0 | 0 | 0 | 0 | |
| Kerosene(KL) | ULVAC Group | 11 | 12 | 14 | 12 | 13 |
| ULVAC Group in Japan | 11 | 12 | 14 | 12 | 13 | |
| ULVAC Group overseas | 0 | 0 | 0 | 0 | 0 | |
| Heavy oil(KL) | ULVAC Group | 15 | 11 | 6 | 2 | 0 |
| ULVAC Group in Japan | 6 | 0 | 0 | 0 | 0 | |
| ULVAC Group overseas | 9 | 11 | 6 | 2 | 0 | |
| Light oil(KL) | ULVAC Group | 148 | 149 | 140 | 452 | 136 |
| ULVAC Group in Japan | 64 | 61 | 113 | 109 | 60 | |
| ULVAC Group overseas | 84 | 88 | 27 | 343 | 76 | |
| Gasoline(KL)※2 | ULVAC Group | 333 | 317 | 313 | ||
| ULVAC Group in Japan | 333 | 141 | 132 | |||
| ULVAC Group overseas | 175 | 181 | ||||
| Total (GJ) | ULVAC Group | 1,520,488 | 1,569,155 | 1,573,308 | 1,586,579 | 1,700,477 |
| ULVAC Group in Japan | 974,003 | 994,067 | 947,597 | 936,409 | 936,866 | |
| ULVAC Group overseas | 546,485 | 575,088 | 625,710 | 650,169 | 763,611 |
※1 The method for tracking gas usage has been revised.
※2 Starting in fiscal year 2022, gasoline usage within Japan was included. Starting in fiscal year 2023, gasoline usage for all groups was included in the scope of aggregation.
■Reduction measures targeting CO2 emissions: Major initiatives
| Measure | Site | CO2 reduction results (metric tons CO2/year) Cost-cutting (thousands of yen) |
|
|---|---|---|---|
| FY2025 Jun. 2026 Emission factors(Japan):0.4436 Emission factors(Korea):0.431 Emission factors(China):0.5892 Emission factors(Taiwan):0.5373 |
Optimizing Cleanroom Air Conditioning Operations | China | CO2 reduction results:164.8t-CO2 / year Cost-cutting:- |
| High-Efficiency Compressor Replacement | Each site | CO2 reduction results:1,173.0t-CO2 / year Cost-cutting:- |
|
| Solar Panel Installation | Korea | CO2 reduction results:626.4t-CO2 / year Cost-cutting:- |
|
| Non-Fossil Electricity Certificates | Each site | CO2 reduction results:18,425t-CO2 / year Cost-cutting:- |
|
| CO2 absorption by ULVAC's Forest Conservation Activities | Chigasaki site | CO2 reduction results: 49.4t-CO2 / year Cost-cutting:- |
Water
Water withdrawals(Thousand m3)
| FY2020 Jun. 2021 |
FY2021 Jun. 2022 |
FY2022 Jun. 2023 |
FY2023 Jun. 2024 |
FY2024 Jun. 2025 |
||
| Service water | ULVAC Group | 616 | 606 | 643 | 581 | 830 |
| ULVAC Group in Japan | 562 | 556 | 597 | 532 | 772 | |
| ULVAC Group in overseas | 55 | 50 | 45 | 49 | 58 | |
| Industrial water | ULVAC Group | 405 | 406 | 518 | 430 | 419 |
| ULVAC Group in Japan | 15 | 14 | 15 | 0 | 0 | |
| ULVAC Group overseas | 391 | 392 | 504 | 430 | 419 | |
| Groundwater | ULVAC Group | 423 | 426 | 414 | 418 | 445 |
| ULVAC Group in Japan | 417 | 426 | 414 | 418 | 445 | |
| ULVAC Group overseas | 6 | 0 | 0 | 0 | 0 | |
| Total | ULVAC Group | 1,444 | 1,438 | 1,575 | 1,429 | 1,694 |
| ULVAC Group in Japan | 993 | 996 | 1,026 | 950 | 1,217 | |
| ULVAC Group overseas | 451 | 442 | 549 | 479 | 477 |
Waste / recycling
■Waste and valuable materials disposal volume
(Metric tons)
| FY2020 Jun. 2021 |
FY2021 Jun. 2022 |
FY2022 Jun. 2023 |
FY2023 Jun. 2024 |
FY2024 Jun. 2025 |
|
| ULVAC Group (Total) | 5,912 | 6,587 | 6,224 | 4,925 | 6,244 |
| ULVAC Group (Recycle) | 4,376 | 2,616 | 4,184 | 2,817 | 4,097 |
| Landfill Rate (ULVAC Group) | 1.4% | 1.4% | 1.6% | 2.5% | 1.5% |
| Volume of waste for final disposal(ULVAC Group) | 80 | 94 | 101 | 121 | 93 |
※ We have revised the definition of "recycled volume," so thermal recycling is no longer counted as part of the recycled volume.
■Breakdown of waste
(Metric tons)
| FY2020 Jun. 2021 |
FY2021 Jun. 2022 |
FY2022 Jun. 2023 |
FY2023 Jun. 2024 |
FY2024 Jun. 2025 |
|
| Sludge waste | 332 | 367 | 322 | 297 | 324 |
| Waste oil | 208 | 388 | 306 | 201 | 194 |
| Waste acid | 254 | 325 | 1,032 | 274 | 372 |
| Waste alkali | 268 | 295 | 359 | 166 | 164 |
| Waste plastic | 391 | 400 | 348 | 293 | 350 |
| Paper | - | 2 | 2 | 13 | 129 |
| Wood scrap | 684 | 648 | 456 | 414 | 378 |
| Scrap metal | 86 | 84 | 48 | 68 | 92 |
| Glass, ceramics | 62 | 59 | 67 | 52 | 46 |
| Slag | 17 | 138 | 106 | 80 | 120 |
| Other Industrial Waste | 220 | 230 | 190 | 144 | 47 |
| Flammable waste oil | 127 | 182 | 200 | 37 | 93 |
| Strong acid | 1,242 | 1,177 | 861 | 1,052 | 833 |
| Strong alkali | 428 | 369 | 172 | 242 | 332 |
| Other Specially Controlled Industrial Waste | 68 | 76 | 61 | 39 | 9 |
| General-purpose paper | 71 | 74 | 44 | 67 | 126 |
| Other General Waste | 317 | 583 | 481 | 479 | 534 |
■Breakdown of valuable materials
(Metric tons)
| FY2020 Jun. 2021 |
FY2021 Jun. 2022 |
FY2022 Jun. 2023 |
FY2023 Jun. 2024 |
FY2024 Jun. 2025 |
|
| Waste oil | 27 | 13 | 13 | 8 | 11 |
| Paper | 104 | 38 | 49 | 29 | 62 |
| Cardboard | 121 | 132 | 170 | 122 | 263 |
| Waste plastic | 20 | 64 | 32 | 6 | 37 |
| Scrap metal | 828 | 859 | 852 | 816 | 1,678 |
| Other Valuable Materials | 36 | 83 | 53 | 27 | 49 |
Chemical substances
■Substances subject to the PRTR Act
Boundary:ULVAC Group in Japan
(Metric tons)
| Substance name | Cabinet order number | FY2020 Jun. 2021 |
FY2021 Jun. 2022 |
FY2022 Jun. 2023 |
FY2023 Jun. 2024 |
FY2024 Jun. 2025 |
|---|---|---|---|---|---|---|
| Indium and its compounds | 44 | 28.9 | 49.9 | 30.3 | 21.0 | 18.2 |
| Nickel compound | 309 | 16.0 | 16.0 | 49.1 | 25.6 | 22.0 |
| Molybdenum and its compounds | 453 | 46.3 | 47.6 | 33.3 | 3.3 | 2.6 |
| Boron compounds | 405 | 16.9 | 0.1 | 0.0 | 16.7 | 19.1 |
| Hydrogen fluoride and its water-soluble salts | 374 | 12.4 | 5.4 | 1.4 | 11.3 | 13.9 |
| Chromium and chromium(III) compounds | 87 | 1.6 | 3.1 | 2.9 | 2.4 | 2.9 |
| Xylene | 80 | 1.3 | 1.3 | 1.0 | 0.9 | 0.4 |
| Hydrazine | 333 | 2.4 | 0.0 | 0.0 | 3.2 | 5.0 |
| Toluene | 300 | 0.7 | 0.8 | 0.4 | 0.9 | 0.9 |
| Silver and its water-soluble compounds | 82 | - | 5.0 | 5.0 | 4.5 | 5.5 |
| Perchloric acid and its ammonium, potassium, sodium, magnesium and lithium salt | 602 | - | - | - | 1.0 | 1.0 |
| Cerium and its compounds | 665 | - | - | - | 1.0 | 1.2 |
| Substance name | Amount of movement (Metric tons) | |||||||||||
|---|---|---|---|---|---|---|---|---|---|---|---|---|
| Emissions to the atmosphere | Emissions to the water system | Recovery as waste | Product movement amount | |||||||||
| Jun. 2023 | Jun. 2024 | Jun. 2025 | Jun. 2023 | Jun. 2024 | Jun. 2025 | Jun. 2023 | Jun. 2024 | Jun. 2025 | Jun. 2023 | Jun. 2024 | Jun. 2025 | |
| Indium and its compounds | 0 | 0 | 0 | 0 | 0 | 0 | 0 | 0 | 0 | 30.3 | 21.0 | 18.2 |
| Nickel compound | 0 | 0 | 0 | 0 | 0 | 0 | 3.9 | 5.8 | 4.5 | 45.2 | 19.8 | 17.5 |
| Molybdenum and its compounds | 0 | 0 | 0 | 0 | 0 | 0 | 0 | 0 | 0 | 33.3 | 3.3 | 2.6 |
| Boron and its compounds | 0 | 0 | 0 | 0 | 0 | 0 | 0 | 16.7 | 19.1 | 0 | 0 | 0 |
| Hydrogen fluoride and its water-soluble salts | 0 | 0 | 0 | 0 | 0 | 0 | 0 | 11.3 | 13.9 | 0 | 0 | 0 |
| Chromium and chromium(III) compounds | 0 | 0 | 0 | 0 | 0 | 0 | 0.2 | 0.1 | 0.1 | 2.7 | 2.3 | 2.8 |
| Xylene | 1.0 | 0.9 | 0.4 | 0 | 0 | 0 | 0 | 0 | 0 | 0 | 0 | 0 |
| Hydrazine | 0 | 0 | 0 | 0 | 0 | 0 | 0 | 3.2 | 5.0 | 0 | 0 | 0 |
| Toluene | 0.4 | 0.9 | 0.9 | 0 | 0 | 0 | 0 | 0 | 0 | 0 | 0 | 0 |
| Silver and its water-soluble compounds | 0 | 0 | 0 | 0 | 0 | 0 | 0 | 0 | 0 | 5.0 | 4.5 | 5.5 |
| Perchloric acid and its ammonium, potassium, sodium, magnesium and lithium salt | 0 | 0 | 0 | 0 | 0 | 0 | 0 | 1.0 | 1.0 | 0 | 0 | 0 |
| Cerium and its compounds | 0 | 0 | 0 | 0 | 0 | 0 | 0 | 0 | 0 | 0 | 1.0 | 1.2 |
■PCB processing status
(Number of units owned)
| FY2020 Jun. 2021 |
FY2021 Jun. 2022 |
FY2022 Jun. 2023 |
FY2023 Jun. 2024 |
FY2024 Jun. 2025 |
|
|---|---|---|---|---|---|
| Transformers | 2 | 2 | 1 | ||
| Capacitors | 4 | 1 | |||
| Fluorescent light ballasts |
■Number of serious legal violations
(Cases)
| FY2020 Jun. 2021 |
FY2021 Jun. 2022 |
FY2022 Jun. 2023 |
FY2023 Jun. 2024 |
FY2024 Jun. 2025 |
|
| Serious legal violations※1 | 0 | 0 | 0 | 0 | 0 |
※1 Serious legal violations:Cases involving administrative penalties and punishments, such as production suspensions and fines
Independent Assurance Report
To ensure the reliability of our disclosed GHG emissions data, we have obtained independent third-party assurance. Please refer to the independent third-party assurance report below for details on the assurance scope, entities covered, and assurance results.
Independent Assurance Report[PDF/1,100KB]
Environment
This website use cookies to obtain and use access data to understand the convenience and usage of customers. If you agree to use cookies, click "I Accept".
[Privacy Policy] [Cookie Policy]